Feature
Weather files
Typical-year weather for the place a model stands: the nearest stations with their design temperatures and degree-days, the hourly year as a 3D surface, wind rose and other charts, and the .epw file on request. Fills Heating and cooling loads.
Use this add-on:
Overview
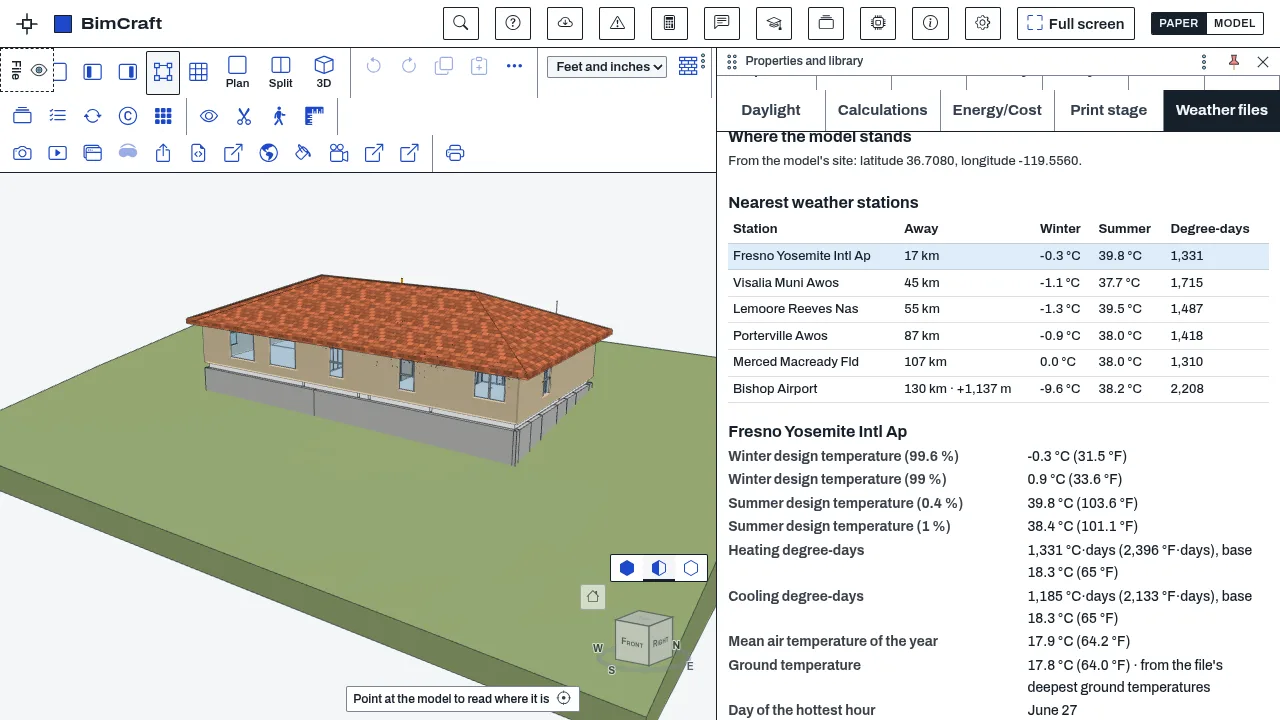
Weather files gives a model the weather of the place it stands. It reads the model's latitude and longitude, lists the nearest weather stations, and shows each one's winter and summer design temperatures and its heating and cooling degree-days. In BimCraft, one press puts those figures into Heating and cooling loads, so the outside temperatures and degree-days are a station's, not something typed from memory. Another press fetches the station's hourly year, an EnergyPlus weather file (.epw), and hands it to the EnergyPlus check or saves it to your computer.
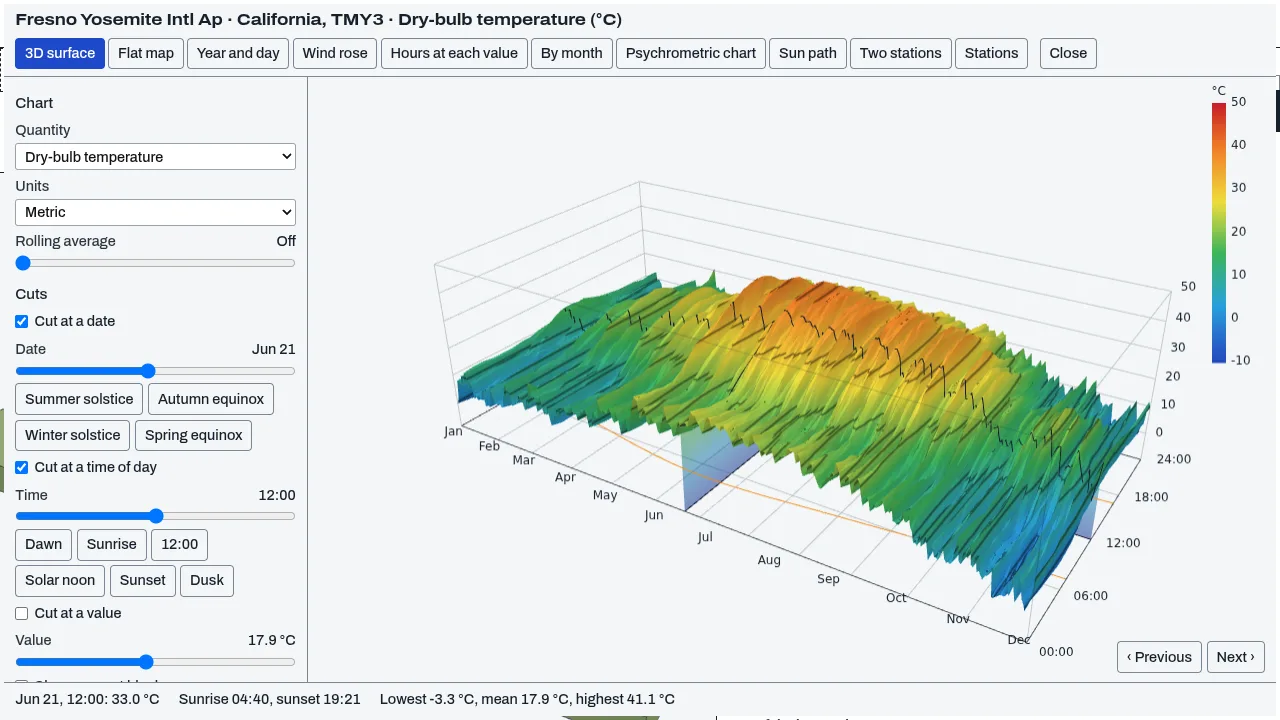
Explore the year opens the station's hours as a 3D surface, a flat map, profiles, a wind rose, a histogram and a monthly table, for every quantity the weather file carries.
In CivilCraft you type the latitude and longitude and use the stations, the year viewer and the .epw file; the hand-offs to Heating and cooling loads and the EnergyPlus check are BimCraft's.
The weather is data, not part of the app. The add-on holds a small list of stations with their figures; a station's year (about 1.5 MB) is fetched only when you ask for the hours. You can also open a weather file of your own and get the same figures from it.
Who it’s for
- Designers and energy modellers who need design temperatures and degree-days for the place a building stands.
- Anyone running the EnergyPlus check for a year, who needs a weather file and does not have one.
- Designers and students who want to see a climate: when it is hot, humid, windy or bright through the year and through the day.
- Mechanical engineers checking a quick heat loss or cooling peak against a station's published design conditions.
What you can do
- See the weather stations nearest your model, with the distance and any large difference in height above sea level.
- Read a station's winter design temperature (99.6 % and 99 %), summer design temperature (0.4 % and 1 %), heating and cooling degree-days, mean air temperature and ground temperature, in °C and °F. verified
- In BimCraft: put the winter and summer outside temperatures, the degree-days and the ground temperature into Heating and cooling loads with one press. The section then says which station they came from.
- In BimCraft: hand the hourly year to the EnergyPlus check for a year's run. In every app: save the .epw file.
- Explore the year: every hourly quantity of the weather file as a 3D surface over the days of the year and the hours of the day, in five views, with cuts at a date, a time and a value, a cut block, a rolling average, contour lines and animation.
- See the same year as a flat map with contour lines and sunrise and sunset, year and day profiles, a wind rose, a histogram and a monthly table.
- See quantities the file does not carry, worked out from it: wet-bulb temperature, humidity ratio, enthalpy, dew-point depression and the height of the sun.
- Plot the hours on a psychrometric chart, set a comfort range of temperature and humidity, and count the hours inside it for the year and each month.
- See the sun's path over the station with each daylight hour coloured by any quantity.
- Compare two stations on one scale, with the difference between them.
- Multiply or shift a quantity for the whole year and save the result as a new .epw file.
- Copy a link that opens the same view for someone else.
- Open any station of a weather set from a map of the stations.
- Switch between metric and US customary units. Save the chart as a picture, the numbers as a table, and the view's settings as a file.
- Open a weather file of your own (.epw) and get the same figures from it.
- Type a latitude and longitude when the model does not say where it stands.
Methods and standards
Stations are ranked by great-circle distance from the model's site. Nothing is interpolated between stations: you pick one, and the panel warns when it is more than 60 km away or 300 m higher or lower than the site.
Design temperatures are the station's published design conditions when the weather file carries them (the file's design-conditions line, read by its Heating and Cooling headings). When a file carries none, they are the temperatures that one typical year stays above (or below) for 99.6 %, 99 %, 1 % and 0.4 % of its hours, and the panel says so, because one year can differ from long-term figures by a degree or two.
Degree-days are counted from the 8,760 hours of the typical year: each day's mean temperature against a base of 18.3 °C (65 °F), summed over the year. The ground temperature is the mean of the file's deepest ground temperatures, or the year's mean air temperature when the file has none.
In the year viewer, each hour is plotted as the file gives it: day of the year by hour of the day. The rolling average is the plain mean of the same hour over the chosen number of days before and after, wrapping round the end of the year. Contour lines are found by marching squares over the day-by-hour grid. The wet-bulb temperature, humidity ratio and enthalpy use the psychrometric equations of the ASHRAE Handbook of Fundamentals, with each hour's own pressure. Sunrise, sunset, the twilights and the height of the sun use the published series for the sun's declination and the equation of time, from the station's latitude, longitude and time zone.
The weather file format is the published EnergyPlus weather format. The reader refuses a file with missing hours or missing temperatures rather than filling them in.
Data and sources
To be written (AL.3): the data it ships, each item cited, and what you supply.
Verification
| Case | Result |
|---|---|
| Design temperatures from the file's own header | A file whose header carries design conditions gives winter 99.6 % -2.5 °C and 99 % -1 °C, summer 0.4 % dry-bulb 39.8 °C and wet-bulb 21.8 °C; a file with none says so and the figures are worked out from the hours instead (bin/test-weather.mjs) |
| A whole year is read, or refused | A file of 8,760 hours is read with its place, ground temperatures and dated hours; a missing-value code is not a number; a file with missing hours is refused, never filled in (bin/test-weather.mjs) |
| The nearest station | Sanger, California: Fresno is the nearest station, some 17 km away and 11 m lower; the great-circle distance Fresno to Sacramento is 248 km (bin/test-weather.mjs) |
| Sunrise and sunset | Fresno on 21 June: sunrise about 04:41 and sunset about 19:21 in standard time, each within 0.06 h (3.6 minutes) of the values worked out by hand (bin/test-weather.mjs) |
| The California set matches its index | All 73 California stations: each file's size and SHA-256 equal the index's, and every station's winter design temperature is below its summer one (bin/test-weather.mjs, built sets on disk) |
| In a real BimCraft page | In BimCraft's lab build the add-on lists the nearest stations to a model, opens a station's year in the 3D viewer and hands the figures to Heating and cooling loads, in headless Chromium with software drawing; not tried on a real graphics card, a tablet or a phone (tools/weather/browser.mjs) |
Limits
A typical year is what the weather is usually like. It is not a forecast, not the worst case, and not a record of any real year. Design figures size equipment for most hours, not all of them.
The nearest station is not your site. Hills, the coast, a valley floor or a city centre can differ from an airport 20 km away. Check the figures against local knowledge, and use your authority's own design values where it publishes them.
A compliance calculation may require its own weather file and its own software. In California, for example, the energy code's performance method uses the weather files the Energy Commission names, in software it has approved. This add-on does not replace that.
The first weather set covers California only. Other places need a weather file of your own until more sets are added.
The year viewer shows what the weather file holds. An hour the file marks as missing is left as a gap, never filled in. Some files carry no data in some columns (rain and snow are often empty in older typical years); those quantities are not offered. The wet-bulb temperature, humidity ratio, enthalpy and height of the sun are worked out from the file, not measured. Sunrise, sunset and the height of the sun are good to about a minute of time, in the station's standard time. The comfort range is a plain range of air temperature and relative humidity that you set: it is not a comfort standard and leaves out radiant temperature, air speed, clothing and activity. Changing the file multiplies or shifts one quantity for the whole year; it does not edit single hours, humidity does not follow a temperature change, and the design conditions in the file's header are not worked out again, so a changed file is for trying things out, not for sizing or compliance.
Files and formats
Reads EnergyPlus weather files (.epw), from a weather set or your own. Writes nothing into the model: the outside temperatures and degree-days it hands to Heating and cooling loads are kept with that section's inputs in this browser. Saves the .epw file of the chosen station on request. The year viewer saves a picture (.png), tables (.csv) and its own settings (.json, format cadcraft-weather-view).
Weather sets are served as plain files: an index (JSON, format cadcraft-weather-index) and one gzip-packed .epw per station, each checked against the SHA-256 in the index before it is used. The requests carry no cookies and say nothing about your model.
Get started
- Switch the add-on on in Settings, Add-ons, then open the Weather files tab.
- If the model has a site with a latitude and longitude, the nearest stations are listed. If not, type the latitude and longitude.
- Pick a station and read its design temperatures and degree-days.
- In BimCraft, press Use in Heating and cooling loads, then open the Daylight tab and press Work out the loads.
- Press Explore the year to see the station's hours as a 3D surface and other charts.
- In BimCraft, for a year's run in the EnergyPlus check, press Use the year in the EnergyPlus check.
Languages
The text is available in:
- English (en)
Works in
| Edition | Works | Note |
|---|---|---|
| Browser (/use) (yours) | Added on demand | Fetched the first time you use it, then kept for offline use. |
| Studio from getcadcraft.com | Added on demand | Fetched the first time you use it, then kept for offline use. |
| Microsoft Store | Added on demand | Fetched the first time you use it, then kept for offline use. |
| Google Play | Added on demand | Fetched the first time you use it, then kept for offline use. |
| iPad and iPhone (App Store) | Included; switch it on | Part of the reviewed app; your list switches it on. |
| Custom build | Added on demand | Fetched the first time you use it, then kept for offline use. |
Comes with
Nothing else.
Permissions
- Adds a panel section
- Opens or saves its own file types
- Keeps its own settings in this browser
- Talks to a server on the internet
From its manifest. Shown again when an update changes them, and the update waits for your yes.
Versions
| Version | Channel | Date | What changed |
|---|---|---|---|
| 0.11.0 | stable | November 20, 2026 | Signed and published. |
Licence and maker
CadCraft (CadCraft, first-party). Licence: Apache-2.0. Dependencies carry their own licences, listed on their pages.